The YouTube Graveyard: What 7 Years of Data Reveals About Creator Longevity
We tracked 97,601 independent YouTube channels from 2019 to 2026. Only 21% are still growing. This is the most complete picture of YouTube creator longevity ever published, and the implications for brand partnerships are significant.

The short answer: three in four YouTube channels that had at least 10,000 subscribers in 2019 are now dormant, invisible, or gone entirely. Only one in five is in positive growth. This is what the data actually looks like.
We started with a snapshot of 97,601 independent YouTube channels captured in 2019, every channel's subscriber count recorded at that point in time. Not brand channels, not media companies. Independent creators, real people running their own channels, who had at least 10,000 subscribers in 2019 and had been classified as solo independent influencers rather than corporate accounts or news outlets.
In 2026, we queried the YouTube Data API for every single one of them. We pulled their current subscriber count, checked when they last posted a video, and measured their average view count across their five most recent uploads.
That gave us two data points per channel, 2019 subscribers and 2026 activity, and from those two snapshots, we could classify each creator's trajectory over a seven-year window.
What we found is the most complete picture of YouTube creator longevity we have seen. The implications for brand partnerships are significant.
How We Defined the Outcomes
Each channel was assigned to one of six outcomes by comparing its 2019 subscriber count against its 2026 subscriber count and posting activity, all sourced directly from the YouTube Data API:
| Outcome | Definition |
|---|---|
| Breakout | Still actively posting. Subscriber count at least doubled since 2019 (≥2×). |
| Growing | Still actively posting. Subscribers up 20–100% since 2019 (1.2×–2×). |
| Stalling | Still actively posting. Subscribers less than 20% higher than 2019, entropy is slowly winning. |
| Fading | Still posting, but averaging fewer than 2,500 views per video across their last 5 uploads. The algorithm has effectively stopped recommending them. |
| Dormant | No upload in the last 180+ days. The channel has gone quiet. |
| Gone | Channel deleted, no videos present, or inaccessible via the API. |
Breakout and Growing are the only outcomes where a channel is both active and gaining ground. Everything else represents some form of stagnation or decline.
The Headline Numbers
Across all 97,601 independent influencers we tracked:
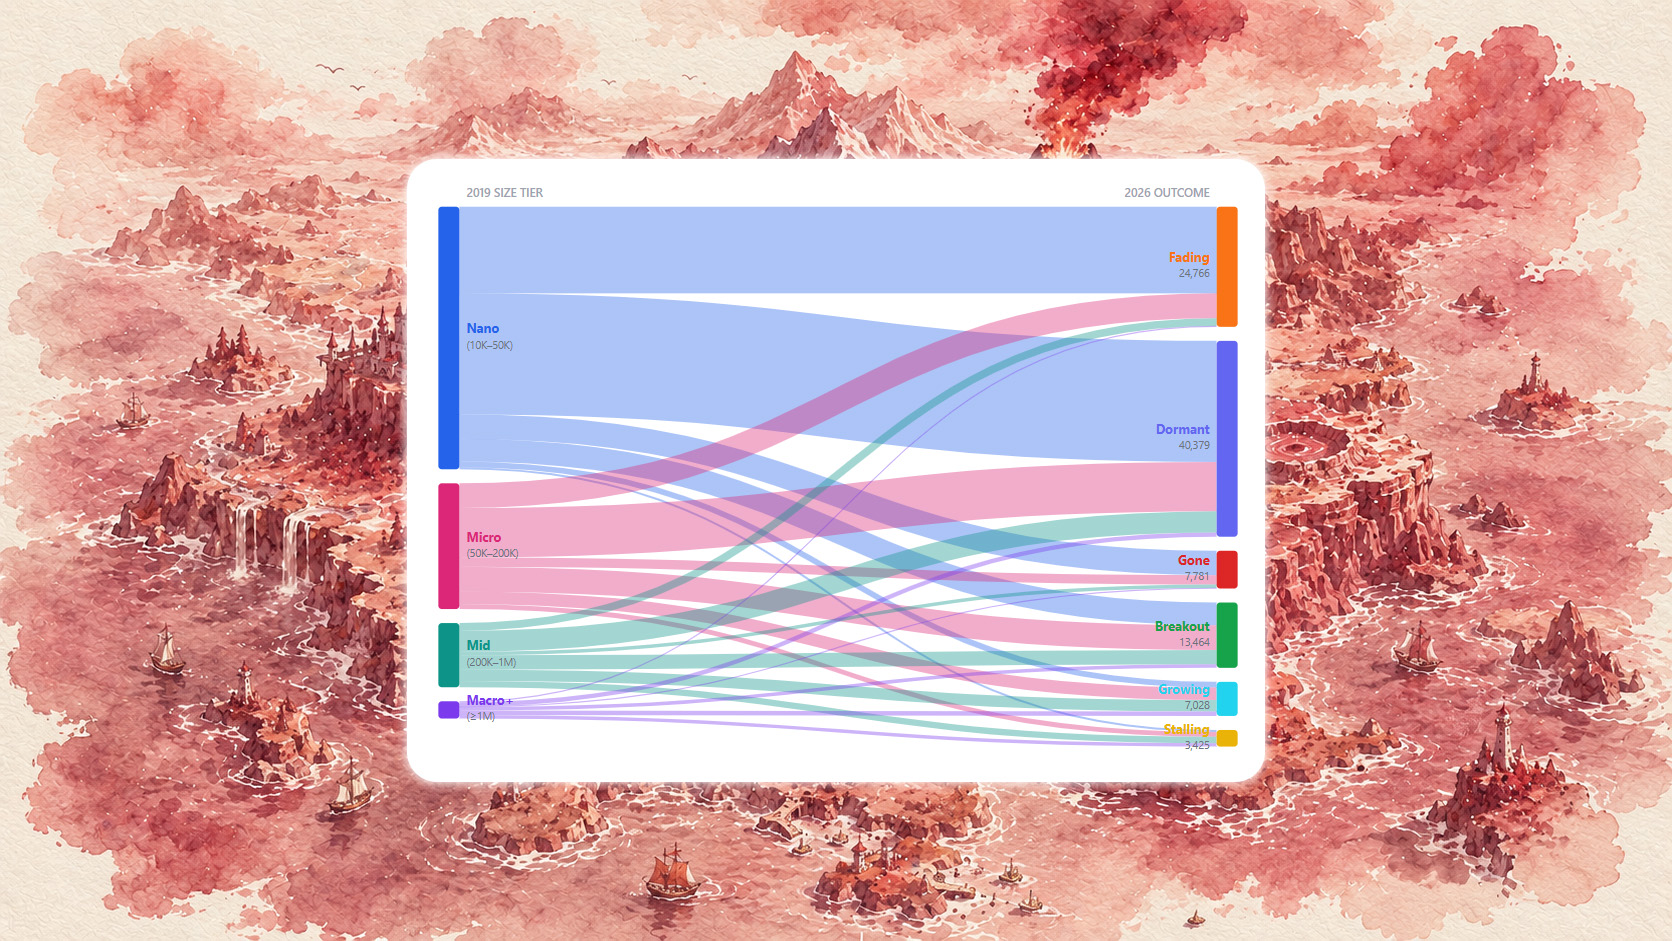
- Dormant: 40,379 channels (41.4%)
- Fading: 24,766 channels (25.4%)
- Breakout: 13,464 channels (13.8%)
- Gone: 7,781 channels (8.0%)
- Growing: 7,028 channels (7.2%)
- Stalling: 3,425 channels (3.5%)
Combined, 74.8% of the 2019 cohort is now Dormant, Fading, or Gone. Only 21% are in positive growth territory (Breakout or Growing). The remaining 3.5% are still posting but going nowhere.
The framing matters: these are not channels that never made it. Every single one of them had at least 10,000 subscribers in 2019, a milestone most aspiring creators treat as meaningful. Three in four of them are no longer a going concern.
Outcome distribution by tier (% of all channels in that tier)
The Nano Problem: Worst Outcomes at Every Level
There are 54,131 channels in what we call the Nano tier, creators who had between 10,000 and 50,000 subscribers in 2019. This is the largest group in our cohort, and by far the hardest hit.
Seven years on:
- Dormant: 46.1% (24,959 channels)
- Fading: 33.0% (17,863 channels)
- Gone: 9.3% (5,033 channels)
- Breakout: 8.7% (4,683 channels)
- Growing: 2.2% (1,185 channels)
- Stalling: 0.8% (408 channels)
Only 11.4% of Nano channels from 2019 are still actively posting today. Only 10.9% are in genuine positive growth (Breakout or Growing combined). The other 88.6% have either stopped, faded into irrelevance, or disappeared entirely.
Nearly half (46.1%) went completely dark. One in three are still uploading to channels the algorithm has stopped recommending, averaging fewer than 2,500 views per video. For context, 2,500 views is roughly what a 10,000-subscriber channel might expect from a single video if engagement is very poor, meaning these Fading Nano channels have audiences that are barely paying attention even when they post.
The 10,000 subscriber mark, often celebrated as a milestone in creator communities, turns out to be far from a stable foundation. It is a starting point. Most who reach it never build on it.
Positive vs. negative outcomes by tier (% of tier total)
What Size Means for Survival
The survival picture improves materially as 2019 channel size increases, but even the largest tier has a significant drop-off rate.
| Tier | Still actively posting |
|---|---|
| Nano (10K–50K) | 11.4% |
| Micro (50K–200K) | 33.5% |
| Mid (200K–1M) | 49.7% |
| Macro+ (≥1M) | 66.7% |
Larger channels survive at higher rates because size provides structural advantages that compound over time. More subscribers mean more baseline views per video, which means more algorithmic signal, which means higher recommendation rates, which means more new viewers, which means further subscriber growth. The rich get richer, not out of talent alone, but because YouTube's recommendation engine rewards channels that already have audience momentum.
Nano channels do not have this buffer. A bad month for a 500,000-subscriber channel is uncomfortable. A bad month for a 15,000-subscriber channel can crater view counts to a point where the algorithm treats the channel as inactive, beginning a degradation cycle that is extremely hard to reverse.
Even among Macro+ channels (those with over 1 million subscribers in 2019), a quarter have gone dormant and 5.5% are Fading. YouTube offers no lifetime guarantee, even to established creators.
One particularly interesting signal from the Macro+ tier: 20% are Stalling, the highest Stalling rate of any tier. Once a channel reaches over a million subscribers, audience expectations rise. Posting "okay" content no longer maintains position. The creators who stagnated at the top did so in a more visible way than those who stagnated at the bottom.
Two Failure Modes: How Channels Actually Die
The data reveals two structurally distinct ways that YouTube channels fall apart.
Burnout and Dormancy: 41.4% of all channels
The most common failure is not a sudden collapse, it is a slow fade into silence. Over 40,000 channels simply stopped uploading. No dramatic finale, no public announcement. They posted, then posted less frequently, then stopped.
This is the compounding problem of creator economics at small scale. A Nano channel posting consistently might generate a few thousand views per video, which translates to a few dollars in ad revenue. There is no financial cushion when motivation dips. When the algorithm doesn't reward a video, view counts fall. Lower views make the next upload feel pointless. The gap between uploads lengthens. Eventually the channel goes quiet.
YouTube then compounds this further: the platform actively penalises inconsistent publishing by reducing distribution to existing subscribers. A channel that takes a two-month break sees its next video reach a fraction of its previous audience, which further discourages the creator, which leads to another long break. The feedback loop runs in one direction.
Algorithmic Abandonment: 25.4% of all channels
The second failure mode is arguably more demoralising: you keep showing up, but nobody is watching. 24,766 channels (a quarter of the entire cohort) are classified as Fading. They posted recently enough to avoid the Dormant flag, but their last five videos averaged fewer than 2,500 views each.
For a channel that had 50,000 or 100,000 subscribers in 2019, getting 2,500 views per video means that roughly 97–98% of their subscriber base is not watching. The YouTube algorithm has essentially decoupled them from their own audience. New viewers are not being sent their way, and old subscribers have moved on or been absorbed by larger channels.
Breakout Channels: How Far the Winners Went
Among the 23,917 active channels where we could compare 2019 and 2026 subscriber counts directly, the growth distribution for survivors is striking:
- Median growth: 2.25× (the median active channel more than doubled)
- Top 25%: ≥ 4.19× growth
- Top 10%: ≥ 8.62× growth
- Top 5%: ≥ 14.85× growth
- Maximum recorded: 1,699× growth
The median active channel doubled its subscribers over seven years. The top decile grew by nearly nine times. These are not modest increments, they represent genuine audience compounding.
The channels that broke out, broke out decisively. One channel went from 23,000 subscribers to 40 million, a 1,699× increase. Another grew from 18,600 to 14.8 million (796×). A third went from 30,800 to 21.1 million (685×). Of the ten biggest growers, seven came from the People & Blogs category, which spans personal vlogs, lifestyle, and direct-to-camera content, the most personal, least produced format on the platform.
The channels with the most explosive growth were not the most technically polished. They were the most human. The format that proved most durable over seven years was one person talking to a camera about their life.
The important caveat: a 2.25× median sounds impressive, but it is the median of a heavily filtered group, channels that survived, stayed active, and had measurable subscriber data. The 88.6% of Nano channels and 66.5% of Micro channels that never made it to "active" status are not included in this distribution. The growth multiplier tells you what winning looked like. The survival rates tell you how rare winning was.
What This Means for Brand Partnerships
Most influencer marketing briefs in 2026 still lead with reach: subscriber count, average views, estimated impressions. These are snapshot metrics, describing a channel's position at a moment in time, not its trajectory.
Our data makes the problem with snapshot thinking concrete.
A channel with 800,000 subscribers that went dormant eighteen months ago has no engaged audience. Its videos receive no algorithmic distribution. Its comment sections are empty. Its subscriber count is a number from 2024 that no longer reflects any live community. Paying to place a brand in that context is not influencer marketing. It is buying space in an abandoned building.
A channel with 90,000 subscribers that has doubled its subscriber count since 2019 and posts weekly is a fundamentally different asset. It has an active community, algorithmic momentum, and a creator who has demonstrated the rarest quality in the space: sustained commitment over years.
YouTube Sponsored Content Is a Long-Term Asset, Not a Short-Term Ad Buy
A sponsored video on YouTube stays on the channel permanently. It sits in the channel's back catalogue, it appears in search results, it surfaces in the "recommended" sidebar, and on a growing channel it gets served to every new subscriber who discovers the channel months or years after you paid for it. The content keeps working long after the invoice is paid.
Consider what this means in practice. A brand invests £2,000 in a sponsored segment on a mid-size YouTube channel with 150,000 subscribers. In month one, the video generates strong views, say 80,000. But the channel is a Breakout: it has been doubling its audience over the past few years and shows no signs of slowing. By year two, that same video is being recommended to a subscriber base of 300,000. By year four, 600,000. The video accumulates views across every one of those years, not because the brand spent anything more, but because the channel kept growing and the algorithm kept surfacing the content to new audiences.
Spread that £2,000 investment over five years of compounding views and the effective cost per year falls to £400. Spread it over the full lifetime of the content, which on a thriving channel can be a decade, and the economics become extraordinary.
Now run the same calculation on a Dormant channel. The £2,000 buys views in the first few weeks, then the channel goes quiet. The algorithm deprioritises inactive channels. The video stops being recommended. Twelve months later, that sponsored content is generating almost no views at all.
Engagement Is the Leading Indicator
The Fading outcome category (24,766 channels still posting but averaging fewer than 2,500 views per video) is the clearest warning signal in our data. These are channels that look alive on paper (recent uploads, an existing subscriber base) but have been effectively deprioritised by the algorithm. A brand that evaluates only subscriber count and posting frequency will mistake a Fading channel for a viable one.
The channels worth partnering with have consistent engagement relative to their audience size, recent subscriber growth, and a posting cadence that reflects a committed and organised creator. These signals predict future performance in a way that subscriber count alone does not.
Align with Momentum, Not History
The 21% of the 2019 cohort that is now growing is a small group, but it contains the channels where brand budgets will perform. A Breakout channel with 200,000 subscribers and a 4× growth multiplier since 2019 has more active audience momentum than a Dormant channel with 1,000,000 subscribers and no uploads in eight months.
Seven years of data says: in influencer marketing, you are not paying for audience size. You are paying for audience attention. And attention follows momentum.
CreatorMap was built on this insight. Our platform maps the full landscape of active, growing independent YouTube creators, scoring channels for trajectory, engagement, and audience alignment, so that brands can identify the channels actually worth partnering with, not just the ones with the biggest historical numbers.
Because after 97,601 data points across seven years, the conclusion is clear: most channels are in decline. The ones that are growing are rare, valuable, and identifiable. You just need the right tool to find them.
Start your free CreatorMap trial and see what momentum-first influencer discovery looks like in practice.
Frequently Asked Questions
What percentage of YouTube channels go dormant?
Based on our study of 97,601 independent YouTube channels tracked from 2019 to 2026, 41.4% went dormant, meaning no upload in 180 or more days. When combined with channels that have faded algorithmically (25.4%) or been deleted entirely (8.0%), 74.8% of channels are no longer a going concern seven years after reaching the 10,000-subscriber milestone.
How long do YouTube channels typically last?
Among channels with at least 10,000 subscribers in 2019, only 21% were still in positive growth by 2026 (seven years later). Survival varies significantly by starting size: 66.7% of channels with 1M+ subscribers remained active, versus just 11.4% of Nano channels (10K–50K subscribers).
What is the survival rate of nano influencers on YouTube?
Only 11.4% of Nano YouTube channels (10K–50K subscribers in 2019) were still actively posting by 2026. Nearly half (46.1%) went completely dormant, 33% became "Fading" (still posting but averaging fewer than 2,500 views per upload), and 9.3% had their channels deleted entirely.
What does "fading" mean for a YouTube channel?
A Fading channel is one that is still uploading content but whose last five videos averaged fewer than 2,500 views each. This indicates the YouTube recommendation algorithm has effectively decoupled the channel from both its existing subscriber base and new viewers. In our 2026 study, 25.4% of all tracked channels were classified as Fading: still posting, but invisible.
Why do most YouTube channels fail?
Our data identifies two distinct failure modes. The first, burnout and dormancy (41.4%), is a gradual fade where creators stop uploading due to low returns and algorithmic penalisation of inconsistent publishing. The second, algorithmic abandonment (25.4%), occurs when creators continue posting but the platform stops recommending their content, resulting in sub-2,500 average views despite having tens of thousands of subscribers.
Does channel size affect YouTube longevity?
Significantly. Larger channels survive at materially higher rates because subscriber count provides structural algorithmic advantages that compound over time. Our data shows: Nano channels (10K–50K): 11.4% still active; Micro (50K–200K): 33.5%; Mid (200K–1M): 49.7%; Macro+ (≥1M): 66.7%. Even at the top tier, one third of channels are no longer active.