What Makes a YouTube Channel Grow: Lessons from 50,000 Channels
We analyzed behavioral data from over 50,000 independent YouTube channels. Upload frequency, hiatus length, and schedule consistency are the strongest predictors of growth. Engagement rate is not.

The most common question in the creator economy is what separates channels that grow from those that don't. It turns out to have a measurable answer. Not a complete one. Content quality, timing, and luck all matter in ways that data cannot fully capture. But underneath those factors, there are behavioral patterns that consistently separate growing channels from stalling ones, and they show up clearly in the numbers.
A word before the data: none of what follows will grow a channel that makes bad videos. The best practice in YouTube is to make great content. The findings documented here identify what the most successful channels do consistently around their content: their posting habits, their scheduling, their metadata. These are supporting behaviors, not substitutes for the thing that actually matters most. Think of them as best practices for everything except the video itself.
We analyzed behavioral data from over 50,000 independent YouTube channels, each with a documented 2019-to-2026 growth trajectory. For each channel, we extracted up to 50 recent videos and computed a range of behavioral metrics: how often they post, how regular their schedule is, how long their videos run, and how their audiences engage. These are the signals the YouTube Data API makes available at scale. There are dimensions of a video that do not appear here, including thumbnail design, title writing, topic selection, and production value. Those things matter too. This analysis covers what we had access to, not everything that influences growth. We then compared those patterns across three outcome tiers: channels that broke out (2× or more subscriber growth), channels that grew modestly (1.2×–2×), and channels that stalled (under 1.2× growth despite continued posting).
Here is what the data found.
How often you post is the single biggest separator
Median upload frequency (videos/month) by growth outcome
The median posting frequency for Breakout channels is 4.53 videos per month. For Growing channels, 2.74. For Stalling channels, 1.52.
That is a 198% difference between the top and bottom tiers. Breakout channels post three times as often as channels going nowhere. It is the highest-magnitude behavioral predictor we found, and the relationship is consistent: at every channel size, from Nano channels with 10,000 subscribers to Macro+ channels with over a million, the channels growing fastest are the ones posting most frequently.
Posting frequency by channel size (for Breakout channels specifically) ranges from 3.8 videos per month at the Nano tier to 5.8 at Macro+. The absolute number shifts with scale, but the principle is the same at every level.
What this finding reflects is not a quality-versus-quantity trade-off. Posting more does not mean posting worse. What it means is that channels committed to growth treat publishing as a regular operational activity, not an occasional creative event. The cadence of posting is itself a signal, to the algorithm and to the audience, that the channel is active, reliable, and worth following.
The practical implication is simple: if a channel can do one thing differently, posting more often is the highest-leverage change it can make.
Never go dark: the strongest single predictor
Median longest hiatus (days between uploads) by growth outcome
The longest gap between uploads correlates with subscriber growth at r = −0.26, the strongest correlation in our entire feature set. More plainly: channels that take long breaks grow the least.
Breakout channels have a median longest hiatus of 35 days. Growing channels: 81 days. Stalling channels: 200 days.
A single six-month gap is often enough to structurally damage a channel's algorithmic position. YouTube's recommendation engine interprets sustained inactivity as disengagement, and it responds by reducing distribution to existing subscribers. When the channel returns, it reaches a fraction of its previous audience. That discourages the creator, which can lead to another long break. The feedback loop can run in either direction.
The channels that avoid this cycle are the ones that compound. They stay in motion, which keeps the algorithm engaged, which keeps new viewers coming, which makes posting feel worthwhile. The number to aim for is straightforward: keep the longest gap under 35–40 days if you want to operate in the range where Breakout channels live.
Consistent beats sporadic: schedule regularity matters as much as frequency
Schedule irregularity (CV of upload gaps) by growth outcome — lower = more consistent
It is not only how often you post, but how predictably. We measured upload cadence using the coefficient of variation (CV) of the gaps between videos. A low CV means a regular, clockwork posting schedule. A high CV means posting five videos one week, then going quiet for two months.
Breakout channels have a median CV of 0.94. Growing channels: 1.21. Stalling channels: 1.58.
The correlation between schedule consistency and subscriber growth is r = +0.21, the strongest positive behavioral predictor in the dataset. It outperforms posting frequency alone.
The distinction is important. A channel that posts eight videos in one month and zero in the next has a high average frequency but terrible consistency. A channel that posts twice a week without fail, every week, has a better consistency score even if its total volume is lower. The most successful channels post on a rhythm that their audience can anticipate, and that the algorithm can rely on.
The combination of posting often and posting regularly is more predictive of growth than either factor on its own.
The professional details add up
Two smaller signals appear in the data, both pointing at the same underlying quality.
Median description length (characters) by growth outcome
Breakout channels write median video descriptions of 512 characters. Stalling channels: 396 characters. A 29% difference. Description length alone will not move the needle; it correlates with subscriber growth at r = +0.08, modest but consistent. What it points to is that channels which write thorough descriptions tend to approach every element of their content with care: thumbnail quality, title clarity, metadata completeness. The description length is a proxy for overall professionalism, and professionalism accumulates.
Median video duration (minutes) by growth outcome
Video length follows the same pattern. Breakout channels run a median of 5.7 minutes. Stalling channels: 4.5 minutes. A 27% difference, with a modest positive correlation. Longer is not inherently better, and the data does not reveal a duration sweet spot that predicts growth in isolation. What it does suggest is that channels willing to commit fully to their subject matter, spending six minutes rather than four, tend to be the ones building something substantial.
Where Breakout channels actually cluster by posting cadence
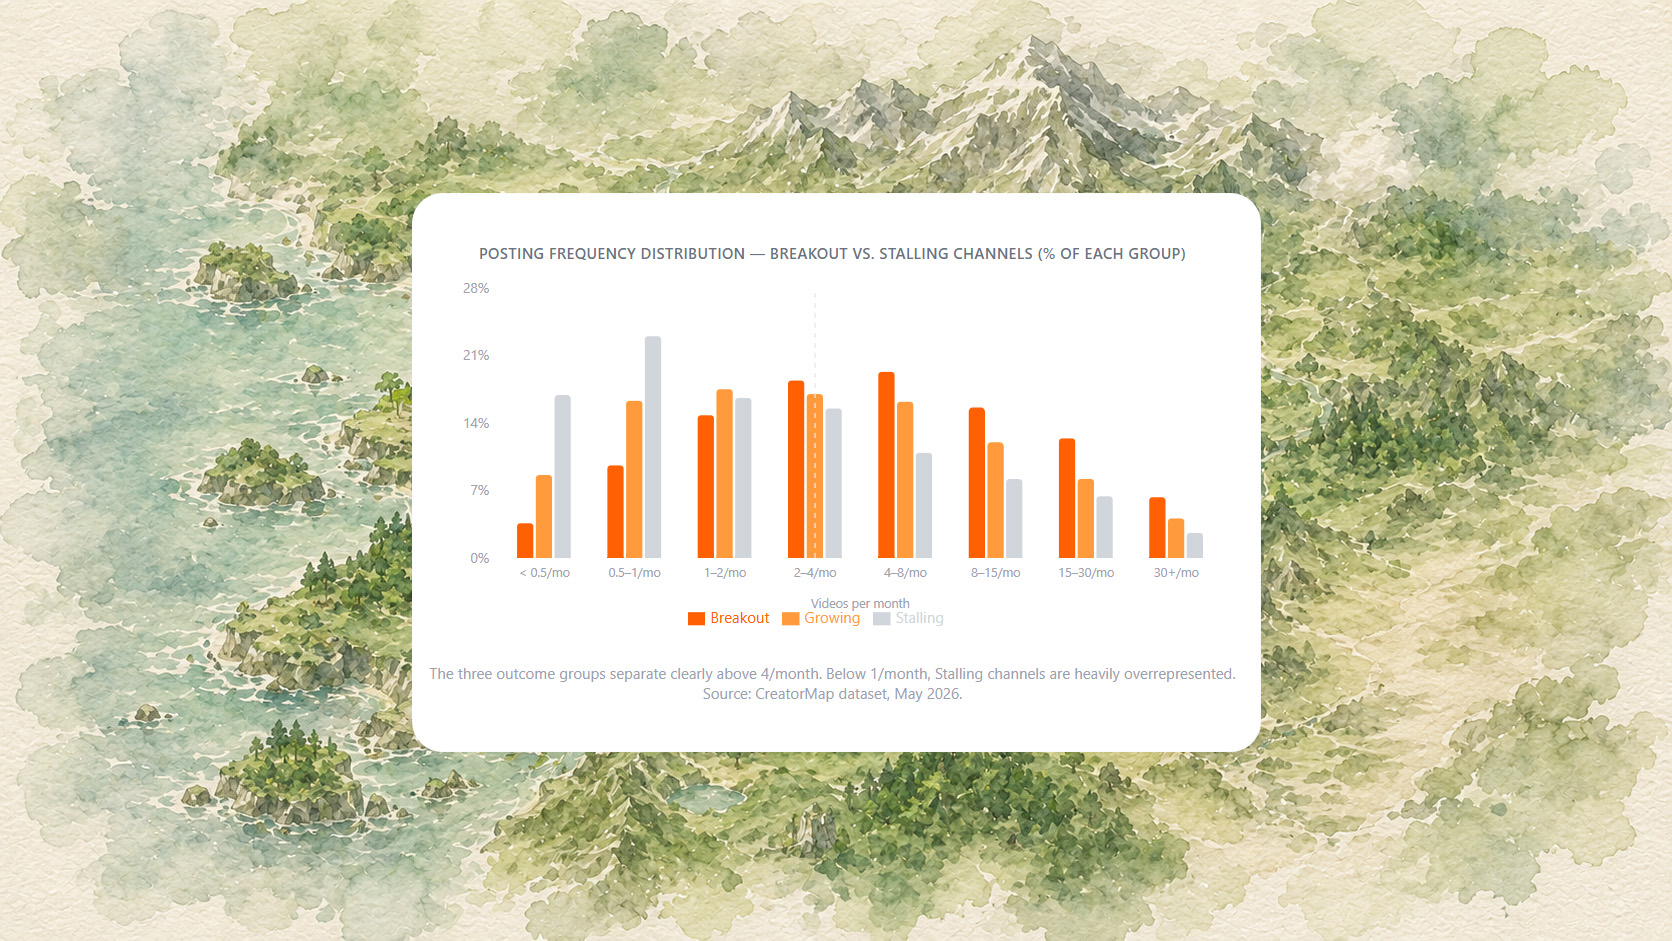
Posting frequency distribution — Breakout vs. Stalling channels (% of each group)
Looking at the full distribution of posting frequency across all three outcome tiers, the groups separate clearly as frequency increases. At lower bands, Stalling channels dominate. At higher bands, Breakout channels do. Growing channels sit consistently in the middle throughout.
Channels posting 30 or more videos per month are 2.4× more likely to be in the Breakout tier than the Stalling tier. Channels posting less than once a month are over 4× more likely to be Stalling.
The most common posting cadence for Breakout channels is 4–8 videos per month, accounting for 19.3% of all Breakout channels. But the 2–4 range (18.4%) and the 8–15 range (15.6%) are also heavily represented. The data does not point to a single optimal cadence. It points to a floor: posting fewer than two videos per month is strongly associated with stalling, and posting four or more is strongly associated with growth.
What engagement rate does not tell you
One finding that consistently surprises people: engagement rate (likes per view) is effectively identical across all three tiers.
Median engagement rate (likes / views %) by growth outcome
Breakout channels: 3.51% median. Growing channels: 3.54%. Stalling channels: 3.55%.
The difference is smaller than measurement noise. Its correlation with growth is −0.03, essentially zero. Channels are not growing because they have unusually high engagement rates, and they are not stalling because engagement is low. If engagement rate is a primary filter in creator evaluation, it is the wrong signal.
What predicts growth, in order of effect size in this data, is posting frequency, avoiding long hiatuses, schedule consistency, and the professional details of description length and video duration. These are all behavioral outputs. They reflect choices creators make repeatedly, week after week, not a talent score measured at a single point in time.
Everything ranked: correlations with growth
Pearson correlation with subscriber growth — behavioral metrics vs. 2019–2026 growth multiplier
The chart above shows the Pearson correlation between each behavioral metric and the 2019-to-2026 subscriber growth multiplier, across all Breakout, Growing, and Stalling channels in the dataset.
The two strongest negative predictors, schedule irregularity and longest hiatus, have nearly identical correlation coefficients (−0.26 each). Both describe the same underlying behavior: channels that go quiet, whether occasionally or erratically, grow significantly less. Posting frequency and consistency score are the two strongest positive predictors. Everything else sits closer to zero.
Engagement rate lands at −0.03, effectively noise. Description length and caption rate have small but consistent positive correlations that likely proxy for general content professionalism. Video duration and tag count are near zero; they may matter within specific niches, but across the full dataset they are not reliable signals.
The picture that emerges is clear: the factors most in a creator's control, how often they post and how reliably they stick to a schedule, are also the most predictive of growth.
What this means for brands
These behavioral patterns are directly relevant to how brands should evaluate creator partners.
A creator posting four or more videos per month, with no gaps longer than 40 days, and a consistent weekly rhythm has demonstrated, through sustained behavior over months or years, that they are genuinely building a channel. A creator with a higher subscriber count but erratic posting and a history of long disappearances has not, regardless of what their headline numbers look like.
The Stalling tier in our data contains channels that are technically active. They post, they have subscribers, they appear in influencer databases with real-looking audience numbers. But the behavioral profile (low frequency, high cadence irregularity, extended hiatuses) signals a channel on a plateau. Placing a brand sponsorship on a plateau is not the same as placing it on a growth curve.
The difference matters most in long-tail value. A sponsored video on a growing channel accumulates views for years as the audience compounds and the algorithm surfaces the content to new subscribers. A video on a stalling channel performs in the first few weeks and flatlines. The total value over time is structurally different.
CreatorMap tracks the behavioral signals described here (posting frequency, hiatus length, schedule consistency) for every channel in our database, so brands can identify creators that are genuinely building, not just maintaining.
Analysis based on over 50,000 independent YouTube channels sourced from the CreatorMap dataset, tracked from 2019 to 2026. Behavioral metrics computed from up to 50 most recent videos per channel as of May 2026.
Key Takeaways
Post at least 4 times per month. Breakout channels post a median of 4.53 videos per month, 3× more than stalling channels. No other single behavior separates the tiers as clearly. Channels posting fewer than twice a month are heavily overrepresented in the Stalling tier; channels at 4 or more per month increasingly dominate the Breakout distribution.
Keep your longest gap under 35–40 days. The maximum gap between uploads is the strongest negative predictor of growth in the dataset (r = −0.26). A single six-month hiatus is often enough to permanently damage a channel's algorithmic position. Breakout channels have a median longest break of 35 days. Stalling channels: 200.
A consistent schedule matters as much as volume. Schedule consistency (r = +0.21) is the strongest positive predictor in the data, slightly ahead of raw posting frequency. A channel that posts twice a week every week beats one that floods the platform for a month and then disappears. The algorithm and the audience both reward predictability.
Engagement rate is not a growth signal. Breakout, Growing, and Stalling channels all sit at ~3.5% engagement rate. The difference between tiers is 0.04 percentage points. Effectively noise. If you are screening creators on engagement rate, you are measuring the wrong thing.
The professional details compound. Longer descriptions (512 vs 396 characters), slightly longer videos (5.7 vs 4.5 minutes), and thorough metadata are consistent characteristics of growing channels. None are strong predictors in isolation, but together they reflect a level of care that shows up across every dimension of the channel.
For brands: measure behavior, not history. Subscriber count is a snapshot. Posting frequency, gap length, and schedule consistency are forward indicators of whether a channel is building or stalling. A 100K channel posting four times a week with a clean gap history is a more valuable partner than a 500K channel posting twice a month with a history of long breaks.